
MRI Explained for Prostate Cancer Results Part1
Understanding MRI Images
1. Action required
Action required
1. Take the MRI, wait one week. (waiting for report)
2. Get your MRI Images on CD disk including report (critical)
Note: I got a PC with window 11. MAC is similar
Sequence of action for a PC Laptop.
1. hook up CD drive to laptop and insert the CD
2. Go to Drive (E)
3. Look for “DCSSTART” file, start program.
4. View Images click, follow instructions, Display
5. Play around, Play around by select different images
6. Go to report, (Image series 4 image 17 in my case), It is the best Image.
The goal is to learn about the cancer location, the size…
anything what we not yet understand about the images.
It is all about learning on a daily bases.
7. Write down the “Gleason score”, “PSA”, “Prostate volume”,
“PSA density”, “Lesion Location”, “Size”, T2 Score, “PIO-RADS score”,
“Contrast was used”.
Now we got all the info we need for the next step of learning.
8. Select the best “Image Series 4, Image 17” in my case.
9. Use the “Snipping Tool” to take a screen shot of the Image.
10. Important: Remove all Meta Data before submitting it to AI.
Now it is getting interesting to see what our friend, the AI can do.
The goal is to play around with different data to see what AI has to say.
11. I use Fire Fox, Duck.ai. this is for privacy. No trust in others.
12. Change the numbers and see the different outcomes.
13. We are learning!
MRI-Image
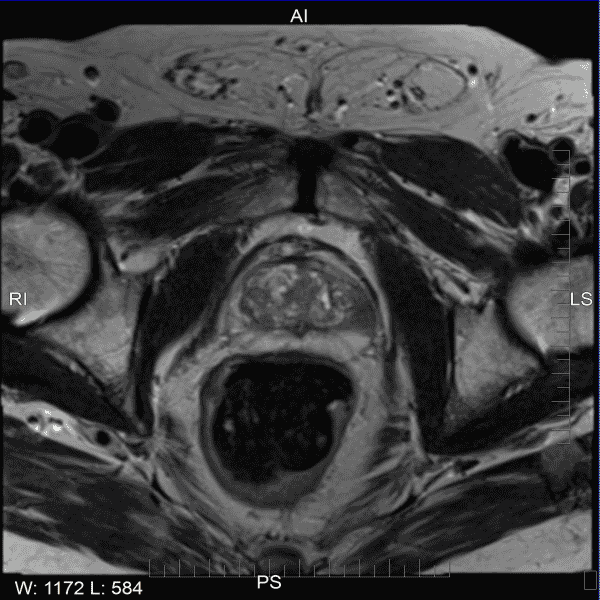
Note: we are learning about the Images and how our body works. Now we can see that everything is interconnected. We want to learn, not to replace the Doctor. This will give us a better understanding about the risk reward of each action we do to our body.
Let me give you an example: First Biopsy is critical and needs to be done without questioning the risk of the sampling of the cancer. We need to find out the aggressiveness of the cancer “Gleason score”. What about the second Biopsy, is it needed?
What information do we have so far?
GO TO:
https://psacancerbegone.com/impressions-mri-results-part3/
Another-Biopsy-needed, that is the question?
Exam Description:
1. MRI with and without IV Contrast
MRI with and without IV Contrast
Excerpt:
Over the past few years, multiparametric MRI (mpMRI) of the prostate has emerged as the most successful radiologic imaging study for detecting prostate cancer. The PI-RADS system and the MRI pathway have paved the way for a widespread usage of this imaging test in daily clinical practice [1]. Prostate MRI is on the verge of opening up further indications towards screening, which is quite remarkable. As a result, the number of prostate MR scans has increased sharply and this trend will continue in the next years. This puts pressure on the justification to perform the most invasive and “controversial” part of MRI of the prostate, the dynamic contrast-medium-enhanced sequence.
2. Gadolinium-based contrast agents (GBCAs)
Gadolinium-based contrast agents (GBCAs)
Excerpt:
Gadolinium contrast agents- challenges and opportunities of a multidisciplinary approach: Literature review.
Contrast agents is used in magnetic resonance imaging (MRI) to improve the visibility of the details of the organ structures. Gadolinium-based contrast agent (GBCA) has been used since 1988 in MRI for diagnostic and follow-up of patients, the gadolinium good properties make it an effective choice for enhance the signal in MRI by increase its intensity and shortening the relaxation time of the proton.
Clinical history:
Biopsy-proven prostate cancer, Gleason score 3+4=7, on active surveillance.
Most resent PSA: 5.86 ng/mL on 02/16/2026.
If available, previous MRI information is compared with the current MRI to see the current changes. In my case we have the Gleason score and the latest PSA number.
Technique:
Multisequence multiplanar MR imaging of the prostate gland was performed on a 3 Tesla magnet. Precontrast 3-plane high-resolution T2-weighted images, axial T1-weighted images, and axial diffusion weighted images with ADC maps of the prostate were obtained. Axial T1, T2, and fat-suppressed T2-weighted images of the whole pelvis were obtained. Dynamic post contrast imaging of the prostrate gland was performed following administration of 12ml Dotarem intravenously. Post processing and gland segmentation was performed on a DynaCAD workstation.
1. Multisequence multiplanar MR imaging
Multisequence multiplanar MR imaging
Excerpt:
Multiparametric-magnetic resonance imaging (mp-MRI) has shown promising results in diagnosis, localization, risk stratification and staging of clinically significant prostate cancer. It has also opened up opportunities for focal treatment of prostate cancer. Combinations of T2-weighted imaging, diffusion imaging, perfusion (dynamic contrast-enhanced imaging) and spectroscopic imaging have been used in mp-MRI assessment of prostate cancer, but T2 morphologic assessment and functional assessment by diffusion imaging remains the mainstay for prostate cancer diagnosis on mp-MRI. Because assessment on mp-MRI can be subjective, use of the newly developed standardized reporting Prostate Imaging and Reporting Archiving Data System scoring system and education of specialist radiologists are essential for accurate interpretation.
2. Precontrast 3-plane high-resolution T2-weighted images
Precontrast 3-plane high-resolution T2-weighted images
Excerpt:
Physics
A T2WI relies upon the transverse relaxation (also known as “spin-spin” relaxation) of the net magnetization vector (NMV). T2-weighting tends to require long TE and TR times.
One way to think about T2 relaxation is as follows:
after an RF excitation pulse, there is relaxation of the spins from the transverse plane toward the main longitudinal magnetic vector (B0) – this is T1-weighting
at the same time, spins are decaying from their aligned precession in the transverse plane – differences in this decay are captured on T2-weighting
3. Axial T1-weighted images
Axial T1-weighted images
Excerpt:
Unlike imaging using radiation, in which the contrast depends on the different attenuation of the structures being imaged, the contrast in MR images depends on the magnetic properties and number of hydrogen nuclei in the area being imaged. Different contrasts in the area being imaged can be selected for by running different sequences with different weightings. The main three sequences are:
- T1-weighted (maximum T1 contrast shown)
- T2-weighted (maximum T2 contrast shown)
- Proton density (PD) weighting (density of hydrogen protons shown)
4. Axial diffusion weighted images
Axial diffusion weighted images
Excerpt:
Abstract
For assessing a cancer treatment, and for detecting and characterizing cancer, Diffusion-weighted imaging (DWI) is commonly used. The key in DWI’s use extracranially has been due to the emergence of of high-gradient amplitude and multichannel coils, parallelimaging, and echo-planar imaging.
5. ADC maps of the prostate were obtained
ADC maps of the prostate were obtained
Excerpt:
Synopsis
A method for simultaneous T1, T2 and Apparent Diffusion Coefficient (ADC) mapping, STimulated-Echo based Mapping (STEM), has been proposed to achieve rapid and co-registered multi-slice T1, T2 and ADC maps within a moderate scan time. In this study, the STEM method is optimized for prostate imaging and evaluated in 16 patients with suspected prostate cancer (PCa) or benign prostatic hyperplasia (BPH). T1, T2 and ADC maps were successfully estimated and compared among BPH, PCa and healthy prostate tissues.
6. Axial T1, T2, and fat-suppressed:
Axial T1, T2, and fat-suppressed: T2-weighted images of the whole pelvis were obtained MRI interpretation T1 v T2 images
Excerpt:
Key points
On T1 images FAT is white
On T2 images both FAT and WATER are white
It’s all about FAT and WATER
The two basic types of MRI images are T1-weighted and T2-weighted images, often referred to as T1 and T2 images.
The timing of radiofrequency pulse sequences used to make T1 images results in images which highlight fat tissue within the body.
7. Dynamic post contrast imaging
Dynamic post contrast imaging
Excerpt:
Dynamic Contrast-Enhanced MRI (DCE-MRI) is a powerful imaging sequence that adds a functional dimension to prostate cancer diagnosis. While T2-weighted imaging provides detailed anatomical views and Diffusion-Weighted Imaging (DWI) reveals cellular density, DCE-MRI visualizes tumor vascularity and tissue perfusion. By tracking how a contrast agent moves through the prostate, this technique helps radiologists characterize
8. 12ml Dotarem intravenously
12ml Dotarem intravenously
Excerpt:
Structured Product Label
The following Structured Product Label (SPL) was submitted to the FDA by Guerbet Llc for the product Dotarem (NDC 67684-3001). This document serves as the official prescribing information, containing essential scientific data and clinical materials required for healthcare providers and patients.
This specific version of the label includes detailed information regarding warning: nephrogenic systemic fibrosis (nsf), 1 indications and usage, 2 dosage and administration, 2.1 dosing guidelines, 2.2 drug handling, 3 dosage forms and strengths, 4 contraindications, 5.1 nephrogenic systemic fibrosis, and other regulatory disclosures. Use the navigation below to review specific sections of the FDA submission.
9. Post processing and gland segmentation
Post processing and gland segmentation
Excerpt:
The impact of pre- and post-image processing techniques on deep learning frameworks: A comprehensi
MRI Findings:
| MRI-Findings:Prostatet Measurement | |||||||
|---|---|---|---|---|---|---|---|
| # | Date | H | L | W | Volume | Density | PSA |
| 1. | 02-12-2024 | 4.8 | 2.5 | 4.1 | 37.2ml | 0.24ng/ml/ | 9.13 |
| 2. | 03-10-2026 | 5.2 | 3.7 | 4.8 | 47.4cc | 0.12ng/ml/ | 4.87 |
MRI Date: 02-15-2024
1. Prostate Measurement:
4.8×2.5×4.1cm. Estimated volume: 37.2 cc
2. PSA density 0.24 ng/ml.
3. Peripheralzone: Areas of linear T2 hypointensity in the peripheral zoneare likly related to scarring or sequelae of prostatitis.
4. Leasion #1: Location: Left anterior mid to base of the peripheralgland (series 4 image 80)
Size: 5mm
5. T2: Score 3 -heterogenous signal intensity of none circumscribed rounded moderate hypointensity
6. DWI: Score 3 -moderately hyperintense
7. ADC: Score 4: markedly hypointense (series 6 image 12; 0.488×10⁻³ )
8. Enhancement: Positive.
9. Extracapsular extension: Unlikely
10. PI-RADS: PI-RADS 4: high (clinically significant cancer is likly to be present).
11. Central gland: There are multiple heterogeneous and nodular encapsulated lesions consistent with BPH.
MRI Date: 03-10-2026
1. Prostate Measurement: 5.2×3.7×4.8cm. Estimated volume: 47.4 cc, previously 37.2 cc.
2. PSA density 0.12 ng/ml/cc, previously Prostatic density: 0.24 ng/mL2.
3. Quality: Motion degrades image quality and limits evaluation.
4. Postbiopsy hemorrhage: None.
5. Peripheral zone: Multifocal linear and wedge-shaped T2 attenuation of the peripheral zone likely related to scarring and/or sequela of prostatitis.
6. Transition zone: Multiple heterogeneous nodules consistent with prostatic hyperplasia.
7. PSA 5.86ng/ml
Leasion # 1:
1. Location: Left, anterior peripheral zone midgland to base.
2. Size: 10mm 9series 4 image17), previously 5mm.
3. T2: Score4, Heterogeneous moderate hypointensity
4. DWI/ADC: Score3 Moderately hyperintense on DWI and markedlyhypointense on ADC.
5. Mean ADC value – 0.655×10⁻³mm2/s.
6. DCE: Positive.
7. Extraprostatic extension: Equivocal. Broad capsular contact is present.
8. PI-RADSscore: 4. PIRADS 4 – High (clinically significant cancer is likelyto be present.
9. Neurovascular bundle: Unremarkable.
10. Seminal vesicles: Unremarkable,
11. Urinary bladder: Urinary bladderwall thickening, likely sequela of chronic outlet obstruction.
12. Rectum/Colon: There is colonic diverticulosis and increased stool in the colon.
13. Lynph nodes: No pathologically enlarged lymph nodes.
14. Bones: No aggressive osseous lesions.
15. Other: No significant pelvic free fluid. Small fat-containing left inguinal hernia.
Inpression:
1. Leasion #1: PIRADS4. 10mm lesion Left anterior peripheral zone mid to base, increased in the interval.
2. Wedge-shaped and linear areas of T2 hypointensityin the peripheral zone likely representing sequelae of prostatitis.
3. BPH of the central gland.
4. Diverticulosis coil.
Number of lesions marked on DynaCAD: One.
MRI More Info:
1. Estimated volume:
Estimated volume: 47.4 cc, previously 37.2 cc
Excerpt:
What is a Normal Prostate Volume?
In healthy adult males, the normal prostate gland measurement is approximately:
Width: 1.6 inches (4 cm)
Height: 1.2 inches (3 cm)
Depth (thickness): 1 inch (2.5 cm)
This results in a prostate that weighs about 0.7 to 1 ounce or 20 to 30 grams. The total prostate volume is 20 to 30 cubic centimeters (cc). For comparison, that’s about the size of a walnut.
Its size allows the prostate to carry out its primary function, which is to produce seminal fluid that nourishes sperm and supports ejaculation.
2. PSA density:
PSA density 0.12 ng/ml/cc, previously Prostatic density: 0.24 ng/mL2.
Excerpt:
Understanding PSA Density and Prostate Cancer
What is PSA Density?
Prostate-specific antigen (PSA) density is calculated by dividing the PSA level by the prostate volume. This metric helps assess the risk of prostate cancer more accurately than PSA levels alone. A higher PSA density indicates a greater likelihood of prostate cancer, while a lower density suggests a lower risk.
Impact of Lower PSA Density
Prognosis: Men with lower PSA density generally have better survival rates. This is because lower density often correlates with less aggressive forms of prostate cancer.
3. Quality:
Quality: Motion degrades image quality and limits evaluations
Excerpt:
Movement artifacts compromise image quality and may interfere with interpretation, especially in magnetic resonance imaging (MRI) applications with low signal-to-noise ratio such as functional MRI or diffusion tensor imaging, and when imaging small lesions. High image resolution has high sensitivity to motion artifacts and often prolongs scan time that again aggravates movement artifacts.
4. Postbiopsy hemorrhage:
Postbiopsy hemorrhage: None.
Excerpt:
Purpose: To retrospectively evaluate the influence of postbiopsy hemorrhage on the accuracy of tumor detection at T2-weighted magnetic resonance (MR) imaging, dynamic contrast material–enhanced MR imaging, and diffusion-weighted (DW) MR imaging of prostate cancer, with histologic findings as the reference standard.
5. Peripheral zone:
Peripheral zone: Multifocal linear and wedge-shaped T2 attenuation of the peripheral zone likely related to scarring and/or sequela of prostatitis.
Except:
MRI of the prostate has become increasingly popular with the use of multiparametric MRI and the PI-RADS classification.
In this article we describe the MR anatomy of the prostate and regional lymph nodes.
6. Transition zone:
Transition zone: Multiple heterogeneous nodules consistent with prostatic hyperplasia.
Excerpt:
Multi-parametric MR imaging of transition zone prostate cancer: Imaging features, detection and staging
7. Postbiopsy hemorrhage:
Postbiopsy hemorrhage: None.
Have you noticed blood in your urine, semen, or stools after your prostate biopsy? Blood in your urine, stools, or semen following a prostate biopsy typically occurs as your body heals from the procedure. The biopsy needle creates minor puncture wounds in the prostate tissue and surrounding blood vessels, which need time to seal and repair.
Follow the Science.
I tried to follow the science, but it led me to nowhere. Then I followed the money — and that’s where I found the science.
Covid-19 Spike Protein Shedding
Now we have to be careful of all those people who took the COVID-19 vaccine. The can give the unvaccinated people the Spike Protein and make them sick. This is called shedding.
Once you got the Covid-19 spike protein you are ready to make as many as you need to get sick. If you are lucky you get a free extended hospital stay or possibly die from it.
Norby