PSA Chart
Summary
PSA Chart over time
Data Source for PSA Numbers
The test result from Doctor stays as is and the test result from Quest Diagnostic gets +20% added.
See Note from Quest Diagnostics.
| # | Date | Raw PSA | +20% | Final PSA | SRC |
|---|---|---|---|---|---|
| 1* | 04/05/2024 | 9.13 | +0% | 9.13 | TX3 |
| 2* | 12/03/2024 | 4.74 | +20% | 5.69 | TX2 |
| 3* | 12/17/2024 | 5.67 | +0% | 5.67 | TX1 |
| 4* | 03/25/2025 | 5.28 | +20% | 6.34 | TX2 |
| 5* | 05/09/2025 | 3.97 | +20% | 4.76 | UT2 |
| 6* | 06/06/2025 | 3.81 | +20% | 4.57 | UT3 |
| 7* | 08/01/2025 | 4.57 | +20% | 5.48 | UT2 |
| 8* | 08/18/2025 | 5.90 | +0% | 5.90 | UT1 |
| 9* | 10/02/2025 | 3.63 | +20% | 4.36 | UT2 |
| 10* | 11/13/2025 | 3.65 | +20% | 4.38 | TX2 |
| 11* | 12/16/2025 | 3.16 | +20% | 3.79 | TX2 |
| 12* | 02/02/2026 | 3.34 | +20% | 4.00 | TX2 |
| 13* | 02/16/2026 | 5.86 | +0% | 5.86 | TX3 |
| 14* | 03/13/2026 | 3.71 | +20% | 4.45 | TX2 |
| 15* | 03/16/2026 | 4.87 | +0% | 4.87 | TX1 |
| 16* | 04/06/2026 | 3.84 | +20% | 4.608 | TX2 |
| 17* | 05/05/2026 | 3.33 | +20% | 3.96 | TX2 |
| 18* | 06/24/2026 | 3.83 | +20% | 4.63 | UT2 |
Data Source for Ivermectin & Fenbendazole
Note 1: CM1 to CM8 ‘Changing Medication’ not reported.
Note 2: Reporting ‘Changing Medication’ with CM-01.
| # | Date | IVER | FB | PSA | SRC |
|---|---|---|---|---|---|
| 1* | 04/05/2024 | 0.0 | 0.0 | 9.13 | TX300 |
| 2* | 10/12/2024 | 12 | 0.0 | 9.13 | CM1 |
| 3* | 10/22/2024 | 12 | 0.0 | 9.13 | CM2 |
| 4* | 11/26/2024 | 0.0 | 0.0 | 9.13 | CM3 |
| 5* | 12/03/2024 | 0.0 | 0.0 | 5.69 | TX2 |
| 6* | 12/17/2024 | 0.0 | 0.0 | 5.67 | TX1 |
| 7* | 01/04/2025 | 18 | 0 | 5.67 | CM4 |
| 8* | 02/18/2025 | 18 | 0 | 5.67 | CM5 |
| 9* | 03/13/2025 | 0.0 | 220 | 5.67 | CM6 |
| 10* | 03/25/2025 | 0.0 | 330 | 6.34 | TX2 |
| 11* | 04/06/2025 | 0.0 | 500 | 6.34 | CM7 |
| 12* | 05/09/2025 | 30 | 500 | 4.76 | TX2 |
| 13* | 05/12/2025 | 30 | 500 | 4.76 | CM8 |
| 14* | 06/06/2025 | 60 | 500 | 4.57 | TX2 |
| 15* | 08/01/2025 | 60 | 500 | 5.48 | UT2 |
| 16* | 08/18/2025 | 60 | 500 | 5.90 | TX1 |
| 17* | 10/02/2025 | 60 | 500 | 4.36 | UT2 |
| 18* | 10/03/2025 | 60 | 250 | 4.36 | CM-01 |
| 19* | 11/13/2025 | 30 | 250 | 4.38 | TX2 |
| 20* | 12/06/2025 | 30 | 250 | 4.38 | CM-02 |
| 21* | 12/16/2025 | 30 | 250 | 3.79 | TX2 |
| 22* | 02/02/2026 | 30 | 250 | 4.00 | TX2 |
| 23* | 02/09/2026 | 30 | 750 | 4.00 | CM-03 |
| 24* | 02/16/2026 | 30 | 750 | 5.86 | TX3 |
| 25* | 03/13/2026 | 30 | 750 | 4.45 | TX2 |
| 26* | 03/16/2026 | 30 | 750 | 4.87 | TX1 |
| 27* | 03/19/2026 | 0.0 | 0.0 | 4.87 | CM-04 |
| 28* | 03/30/2026 | 30 | 750 | 4.87 | CM-05 |
| 29* | 04/06/2026 | 30 | 750 | 4.61 | TX2 |
| 30* | 05/05/2026 | 30 | 750 | 3.96 | TX2 |
| 31* | 05/14/2026 | 30 | 440 | 3.96 | TX2 |
| 32* | 05/14/2026 | 30 | 440 | 3.96 | CM-06 |
| 33* | 06/24/2026 | 36 | 440 | 4.63 | UT2 |
| 34* | 06/25/2026 | 36 | 440 | 4.63 | CM-07 |
Jump directly to Reff. # off Diary 1
| # | Date | FINAL PSA | Diary Reff# |
|---|---|---|---|
| 1* | 04/05/2024 | 9.30 | Reff. #3 |
| 2* | 10/12/2024 | 9.30 | Reff. #16 |
| 3* | 10/22/2024 | 9.30 | Reff. #16 |
| 4* | 11/26/2024 | 5.53 | Reff. #17 |
| 5* | 12/03/2024 | 5.69 | Reff. #18 |
| 6* | 12/18/2024 | 5.69 | Reff. #19 |
| 7* | 01/04/2025 | 5.69 | Reff. #19 |
| 8* | 01/03/2025 | 5.48 | Reff. #20 |
| 9* | 02/18/2025 | 5.90 | Reff. #50 |
| 10* | 03/13/2024 | 5.69 | Reff. #53 |
| 11* | 03/24/2025 | 6.34 | Reff. #54 |
| 12* | 03/06/2025 | 6.34 | Reff. #59 |
| 13* | 05/09/2025 | 4.76 | Reff. #64 |
| 14* | 05/12/2025 | 4.76 | Reff. #67 |
Jump directly to Reff. # off Diary 2
| # | Date | FINAL PSA | Diary Reff# |
|---|---|---|---|
| 15* | 06/09/2025 | 4.57 | Reff. #84 |
| 16* | 06/09/2025 | 4.57 | Reff. #84 |
| 17* | 08/02/2025 | 5.48 | Reff. #88 |
| 18* | 08/18/2025 | 5.90 | Reff. #90 |
| 19* | 10/03/2025 | 4.36 | Reff. #91 |
| 20* | 10/03/2025 | 4.36 | Reff. #92 |
| 21* | 12/16/2025 | 3.79 | Reff. #98 |
| 22* | 02/02/2026 | 4.00 | Reff. #101 |
| 23* | 02/16/2026 | 5.86 | Reff. #105 |
| 24* | 06/24/2026 | 4.63 | Reff. #122 |
PSA Chart1 From 04-05-2024 to 05-14-2026
Starting Number: PSA 9.13
Lowest Number: PSA 3.79
Current Number: PSA 4.63
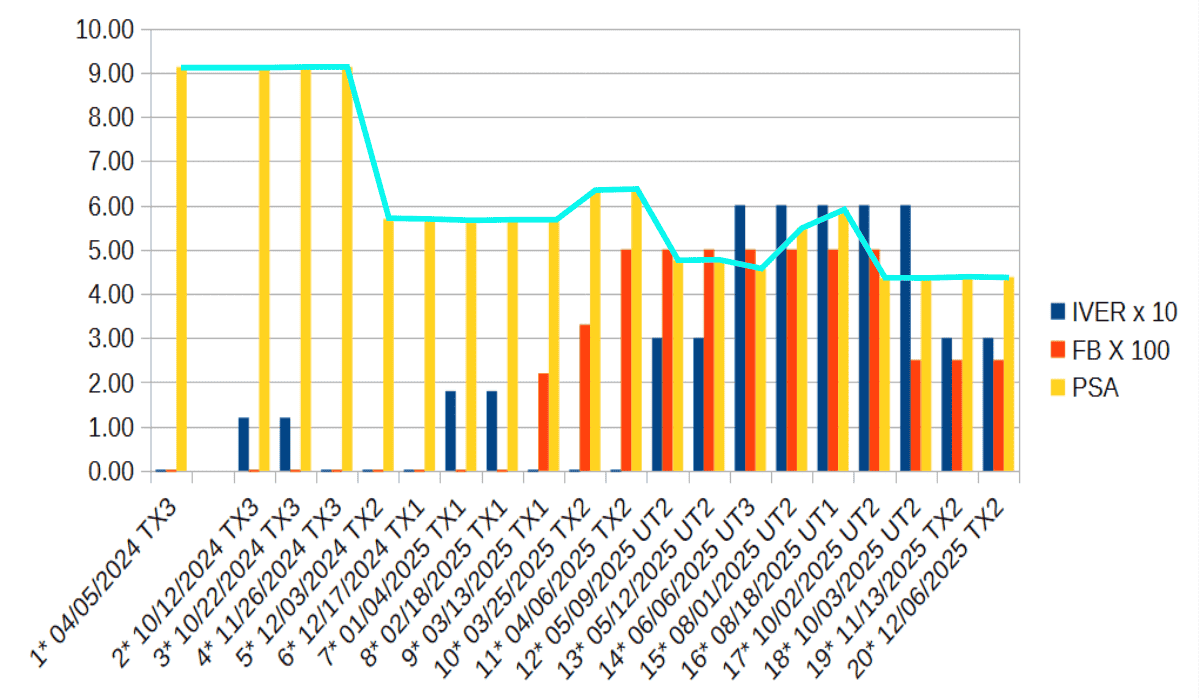
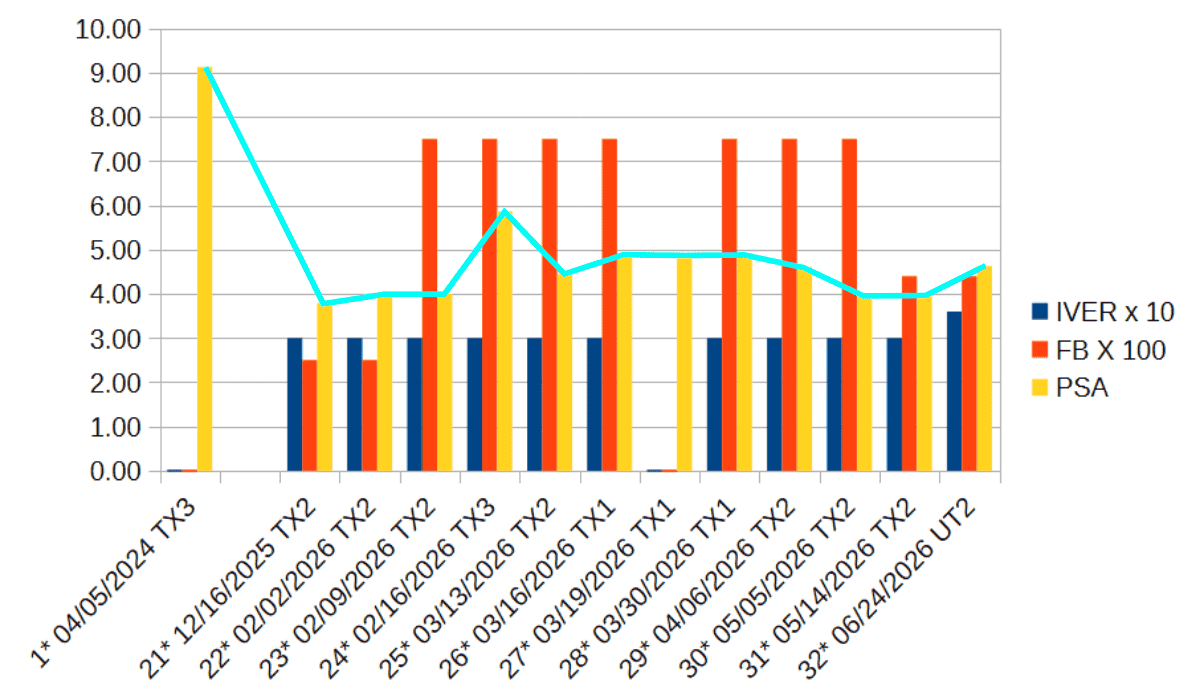
Note 1: Time is not equally spaced
Note 2: Ivermectin multiply by 10x.
Note 3: Fenbendazole multiply by 100x.
Note 4: This is all done so we can see the PSA number change easily.
Hospitals PSA test verses Quest Diagnostics?
Since I am an independent person, I needed to know if there is a difference with the PSA test done in the doctors office or done with Quest Diagnostic. That was the question for me.
I took a PSA test with Quest Diagnostics on 12-03-2024. The PSA test result was 4.74. Now I need to add plus 20% equals 5.688. See Note from Quest Diagnostics.
Now to my Doctor PSA test on 12-17-2024 it was 5.67H
Please note, there was a lag time of four days. So, the PSA number could have changed for the test on the 12-17-2024. I do not think so in that short amount of time. That is just Norby’s thinking.
This tells me that I can compare both results and can use the test from Quest Diagnostic as equivalent to the Doctors test. This makes it possible for me to check my PSA independently.
Norby
Quest Diagnostics PSA result plus 20%.
Read the Lab Notes from Quest Diagnostics. This is why I take the worst case scenario for the PSA test. PSA test result plus 20% will give me a closer number to the PSA test from doctor.
1. Search for Quest diagnostics
2. Login: MyQuest
3. Got to: Test Results
4. Search for: Lab Notes
Lab Notes:
The total PSA value from this assay system is standardized against the WHO standard. The test result will be approximately 20% lower when compared to the equimolar-standardized total PSA (Beckman Coulter). Comparison of serial PSA results should be interpreted with this fact in mind.
This test was performed using the Siemens chemiluminescent method. Values obtained from different assay methods cannot be used interchangeably. PSA levels, regardless of value, should not be interpreted as absolute evidence of the presence or absence of disease.